


Quick answer
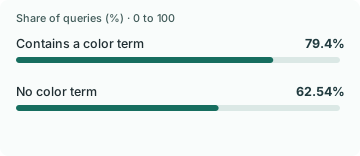
In the US test split of Amazon’s public Shopping Queries Dataset, 79.40% of queries with a color term had both an exact candidate and a substitute, compared with 62.54% of queries without one. When a shopper asks for a specific color, check whether the recommended variant matches and label other options as alternatives.
Key findings and sources
Exact matches and substitutes often appeared together
In Checkout Reply’s reanalysis of the public Amazon ESCI US test split, 1,002 of 1,262 color-term queries (79.40%) contained both an exact product candidate and a substitute. The equivalent share for other queries was 62.54%.
Amazon Science, Shopping Queries Dataset
Substitutes made up a larger share of color-term candidates
Among 25,466 judged product candidates for color-term queries, 31.51% were labeled substitutes. The share among 400,296 candidates for other queries was 21.74%. The unit is a judged query–product pair.
Amazon Science, Shopping Queries Dataset
Almost every benchmark query had an exact candidate
The public US large-task test split contained 22,458 query IDs. One had no exact candidate, and that query contained a substitute. The curated split provides evidence about candidate mix and limited evidence about live no-match frequency.
Amazon Science, Shopping Queries Dataset
The benchmark uses four relevance classes
Amazon’s public Shopping Queries Dataset separates exact matches, substitutes, complements and irrelevant candidates. The color-term comparison reuses those supplied labels and adds a fixed lexical rule at the query level.
Amazon Science, Shopping Queries Dataset
Exact and substitute candidates coexisted more often in deeper benchmark lists
In the US large-task test split of Amazon ESCI, 11,448 of 18,903 queries with 11–20 judged candidates had an exact match and a substitute (60.56%). The share was 80.79% among 3,327 queries with 21 or more judged candidates.
Amazon Science, Shopping Queries Dataset
Amazon ESCI public 2022 US large-task held-out split, using judged candidate counts per query. Count queries containing both labels within each candidate-depth band, then divide by queries in that band.
Pair weighting and equal query weighting produce different exact-match shares
In the same US ESCI split, exact labels accounted for 65.14% of 425,762 candidate pairs. Averaging within-query exact shares with one vote per query gave 65.67% across 22,458 query IDs.
Amazon Science, Shopping Queries Dataset
US held-out large-task split of the Amazon Shopping Queries Dataset. First divide all exact pairs by all pairs. For the second measure, take the mean of the exact share within each query.
Compare the results
A similar product can solve the wrong problem
A shopper asking for a navy dress in a particular size may accept another color, but the recommendation has to tell them which condition changed. A substitute is still useful when the exact option is unavailable and the shopper has a choice. Counting the substitute as an exact answer hides a mismatch until the shopper clicks.
The benchmark labels candidates as exact matches, substitutes, complements or irrelevant. We keep those distinctions when checking whether a query produces both a precise option and a plausible alternative. A related item can help with a separate need without resolving the original request.
Count candidate products and shopper questions separately
The color-term group contained 1,262 queries and 25,466 judged candidates. Substitutes made up 31.51% of those candidates, compared with 21.74% of 400,296 candidates for queries without a color term. The difference tells you what a reviewer may encounter when inspecting the candidate pool.
At the query level, 1,002 color-term queries had both an exact match and a substitute. Nearly every query in the entire benchmark split had at least one exact candidate. That selection makes this useful for checking whether alternatives are correctly separated from exact options. It provides little evidence about the frequency of no-match situations on a live store.
Review the answer against the variant the shopper can buy
For a sample of your own store questions, record requested size, color, fit and any price ceiling. Check the item and variant selected by the link. Grade the answer as exact, transparent alternative, missing information, or incorrect. Include a few cases where the exact variant is sold out and the substitute is available so a tool can demonstrate how it handles the choice.
Keep availability and price as separate checks. A correct product recommendation can still send the shopper to a default size or an expired price. If the system cannot establish the variant, the useful next step is to confirm the missing detail or offer the verified alternative with the difference spelled out.
The result set matters before you compare substitute rates
Among US benchmark queries with 11 to 20 judged products, 60.56% had both an exact match and a substitute. For queries with at least 21 judged products, the share was 80.79%. The 20.23-point difference is large enough to change the mix of cases a review team sees. A bigger judgment set offers more opportunities to observe both labels, and the benchmark’s deeper lists may come from different queries. The grouping is a sensitivity check on what is in the benchmark.
A merchant can avoid the corresponding sampling trap by asking how many candidate products each query is allowed to surface. A test with a long candidate list can produce more correct options and more tempting near misses. A test that inspects only one recommendation answers a narrower question about the final choice. Keep list breadth explicit when comparing retrieval changes.
Use one vote per question when the decision is about a shopper reply
In this US split, 65.14% of all judged pairs were exact. Averaging the exact share within each query instead gives 65.67%. The second calculation gives each question the same weight. The difference is modest here, but the method is worth preserving because a catalog of densely judged queries can otherwise dominate the result.
For product recommendations that lead to checkout, decide which score you are trying to improve. A retrieval team can inspect candidate quality across all returned products. A sales team should count the final reply once per shopper question and assess whether the first offered choice honors the constraint. Include a matched unavailable-variant fixture as a separate condition. A good substitute can be helpful while still being a different outcome from an exact answer.
Study data
| Measure | Value | Context |
|---|---|---|
| Color term group, queries | 1,262 queries | US locale, large task, test split; one pair per labeled query–product record |
| Color term group, candidate pairs | 25,466 pairs | US locale, large task, test split; one pair per labeled query–product record |
| Color term group, exact pairs | 14,756 pairs | US locale, large task, test split; one pair per labeled query–product record |
| Color term group, substitute pairs | 8,024 pairs | US locale, large task, test split; one pair per labeled query–product record |
| Color term group, complement pairs | 437 pairs | US locale, large task, test split; one pair per labeled query–product record |
| Color term group, irrelevant pairs | 2,249 pairs | US locale, large task, test split; one pair per labeled query–product record |
| Color term group, queries containing both an exact match and a substitute | 1,002 queries | US locale, large task, test split; one pair per labeled query–product record |
| Color term group, queries without an exact match | 0 queries | US locale, large task, test split; one pair per labeled query–product record |
| Color term group, exact candidate share | 57.94% | 14,756 divided by 25,466 |
| Color term group, substitute candidate share | 31.51% | 8,024 divided by 25,466 |
| Color term group, queries with both | 79.4% | 1,002 divided by 1,262 |
| No color term group, queries | 21,196 queries | US locale, large task, test split; one pair per labeled query–product record |
| No color term group, candidate pairs | 400,296 pairs | US locale, large task, test split; one pair per labeled query–product record |
| No color term group, exact pairs | 262,592 pairs | US locale, large task, test split; one pair per labeled query–product record |
| No color term group, substitute pairs | 87,030 pairs | US locale, large task, test split; one pair per labeled query–product record |
| No color term group, complement pairs | 10,485 pairs | US locale, large task, test split; one pair per labeled query–product record |
| No color term group, irrelevant pairs | 40,189 pairs | US locale, large task, test split; one pair per labeled query–product record |
| No color term group, queries containing both an exact match and a substitute | 13,255 queries | US locale, large task, test split; one pair per labeled query–product record |
| No color term group, queries without an exact match | 1 queries | US locale, large task, test split; one pair per labeled query–product record |
| No color term group, exact candidate share | 65.6% | 262,592 divided by 400,296 |
| No color term group, substitute candidate share | 21.74% | 87,030 divided by 400,296 |
| No color term group, queries with both | 62.54% | 13,255 divided by 21,196 |
What changes when you compare the figures
| Comparison | Result | Calculation |
|---|---|---|
| Color term group, exact candidate share | 57.94% | = 14756 / 25466 * 100 |
| Color term group, substitute candidate share | 31.51% | = 8024 / 25466 * 100 |
| Color term group, queries with both | 79.4% | = 1002 / 1262 * 100 |
| No color term group, exact candidate share | 65.6% | = 262592 / 400296 * 100 |
| No color term group, substitute candidate share | 21.74% | = 87030 / 400296 * 100 |
| No color term group, queries with both | 62.54% | = 13255 / 21196 * 100 |
| Extra substitute candidate share in the color-term group | 9.77 percentage points | = 8024 / 25466 * 100 - 87030 / 400296 * 100 |
| Gap in queries with both types | 16.86 percentage points | = 1002 / 1262 * 100 - 13255 / 21196 * 100 |
| Share with exact and substitute, 11 to 20 candidates | 60.562% | = 11448 / 18903 * 100 |
| Share with exact and substitute, 21 or more candidates | 80.794% | = 2688 / 3327 * 100 |
| Depth-band difference in exact-and-substitute coexistence | 20.232 percentage points | = (2688 / 3327 - 11448 / 18903) * 100 |
| US exact pair share | 65.142% | = 277348 / 425762 * 100 |
Methodology and sources
Count each judged pair once within the public US large-version test split, then group pairs by query ID. The color-term group matches whole words black, white, red, blue, green, yellow, orange, pink, purple, brown, gray or grey. The complement contains all other queries. Pair shares and query shares have different denominators. The benchmark includes curated difficult queries and candidate lists. We did not observe result order, store traffic, ranking quality, live variant stock, or purchases.
Download the source data (CSV)
Download the calculations (CSV)
Download the citation notes (CSV)
Download the reproducible analysis script
Related reading
AI shopping recommendation accuracy statistics
Ecommerce product review statistics and what shoppers use to decide
Sources and definitions
Amazon Science, Shopping Queries Dataset
The source data includes the population, period, denominator and limitations for every figure.