


Quick answer
In First Page Sage’s September to October 2026 benchmark, wrong-price or out-of-stock classifications together ranged from 8.4% for Amazon Rufus to 31.0% for DeepSeek. Across the eight platforms, those two categories made up about 85% to 97% of classified errors after normalizing each platform separately.
Key findings and sources
The combined price and stock classification
In First Page Sage’s 28 September to 14 October 2026 benchmark, wrong-price and out-of-stock or discontinued classifications added to 8.4% of checked Amazon Rufus recommendations, 10.5% for Gemini, 13.7% for ChatGPT and 31.0% for DeepSeek. Each percentage uses its own platform row.
First Page Sage, Which AI Is Best for Shopping?
A different denominator for the error mix
In Checkout Reply’s reanalysis of First Page Sage’s September to October 2026 figures, 13.7 of ChatGPT’s 15.1 percentage points of errors were wrong price or out of stock, about 90.73% of classified errors. The 13.7% figure instead uses all checked recommendations.
First Page Sage, Which AI Is Best for Shopping?
Why a smaller error rate can have a larger price-and-stock share
Using First Page Sage’s 2026 table, price-or-stock classifications account for 96.55% of Amazon Rufus’s classified errors and 84.93% of DeepSeek’s. Their shares of all checked recommendations were 8.4% and 31.0%, respectively.
First Page Sage, Which AI Is Best for Shopping?
When the stock column is larger than the price column
First Page Sage reported that 4.5% of checked Amazon Rufus recommendations were out of stock or discontinued and 3.9% had a wrong price in its September to October 2026 benchmark. Rufus was the only platform in that table where the stock category exceeded the price category.
First Page Sage, Which AI Is Best for Shopping?
What the public offer check can support
First Page Sage’s 2026 shopping benchmark assigned each checked recommendation to one of four offer outcomes after comparing it with the retailer’s listing. Its platform rows describe that test period. They do not establish the probability of error for a particular store, shopper or current cart.
First Page Sage, Which AI Is Best for Shopping?
Price made up different shares of classified offer errors
In the First Page Sage benchmark, wrong-price entries were 59.12% of the wrong-price plus unavailable classifications for ChatGPT and 46.43% for Rufus. The calculation uses each platform’s own two-category subtotal.
First Page Sage, Which AI Is Best for Shopping?
The composite winner and offer-check winner were different
First Page Sage’s 2026 benchmark gave Google Gemini a composite score of 88.7 and Amazon Rufus 85.7. Rufus led the checked correct-and-in-stock-at-price measure by 2.7 percentage points, 91.3% to 88.6%.
First Page Sage, Which AI Is Best for Shopping?
Vendor benchmark of AI shopping recommendations, September to October 2026. Subtract the composite scores and separately subtract the availability-and-price shares.
The composite and offer comparisons use different units
In the same benchmark, the 3.0-point Gemini composite advantage and the 2.7-percentage-point Rufus offer advantage describe separate measures. Rufus’s recommendations were restricted to products sold on Amazon.
First Page Sage, Which AI Is Best for Shopping?
Same publisher’s aggregate platform rows, with differing recommendation pools. Compare each metric within its own scoring or recommendation denominator.
Compare the results
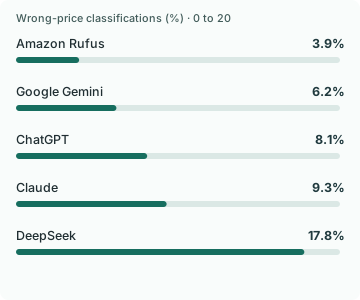
Most classified errors involved the offer
First Page Sage checked recommended products against live retailer listings and recorded one of four outcomes. Adding wrong-price and out-of-stock or discontinued shares gives 8.4% for Amazon Rufus, 10.5% for Gemini, 13.7% for ChatGPT and 31.0% for DeepSeek. The eight rows are platform-specific observations from the same study period.
We also asked how much of each platform’s observed error mix belonged to these two groups. For ChatGPT, the 13.7 percentage points of price-or-stock classifications make up 90.73% of the 15.1 percentage points of classified errors. For Amazon Rufus, 8.4 of 8.7 points make up 96.55%. DeepSeek’s share was 84.93%. Those proportions are conditional on an error, so they cannot be read as the share of all recommendations.
The practical difference is where to invest in verification. An assistant can return a real product with a working link and still quote a price the shopper cannot get or a variant they cannot buy. Match the offer and variant before treating a successful product lookup as ready for checkout.
Use two denominators before deciding which problem to prioritize
Use all checked recommendations to understand how often a shopper might encounter each classified issue under the benchmark conditions. Use only classified errors to understand the composition of problems that went wrong. A high conditional share can coexist with a relatively low absolute frequency, as the Rufus figures illustrate.
If your own evaluation accepts a wide range of alternatives, track whether the requested item was unavailable and separately whether the substitute was acceptable. A model can be correct to say an item is out of stock. The error is directing the shopper to buy it as though it were available, or applying its quoted price to a different offer.
The benchmark uses rounded category percentages. We add categories only because the study assigns one outcome to each recommendation. We do not pool rows or compute a confidence interval without each platform’s raw checked count. The checked offer mix and access differ by platform, including Rufus’s restriction to the Amazon catalog.
Define the offer you need the assistant to verify
For a real cart, retain the seller, selected variant, destination, currency, applicable price and inventory state. A product detail page may show a starting price, a subscription price or a price for a different size. A live response from the retailer is only useful if it describes the item and conditions the buyer actually selected.
Google Merchant Center’s price-mismatch guidance gives merchants a second way to think about the problem. Verify that the submitted price matches the landing page and the purchase path for the item. A model could inherit a stale feed value or choose a valid product page that defaults to the wrong variant. Checking both the information and the destination gives you a way to distinguish those failures.
Put exact variants into an evaluation with deliberately different offers, such as a sale-only color, an out-of-stock size and a bundle whose price differs from the individual item. Score price, stock and usable checkout link separately. Use a recorded timestamp and region so another reviewer can reproduce the decision.
A safe reply can still help when the offer is uncertain
If checkout availability cannot be confirmed, state the uncertainty and offer to check the exact size or destination. If a current alternative is available, verify that it satisfies the constraint the shopper originally gave. Avoid substituting a nearby item just because it has a live link.
For the store’s test, track when the assistant correctly pauses, whether the shopper then clarifies and whether the completed order matches the proposed item. Use the public benchmark to design the cases and your store’s own evidence to measure what the assistant does on its catalog.
Choose whether to test price or availability first
A single offer-accuracy score tells you whether the shopping answer is usable. It gives less direction about which feed field to fix first. In the First Page Sage table, wrong prices made up 59.12% of the two offer-issue categories for ChatGPT and 46.43% for Rufus. The remaining share in those two-category buckets was out of stock or discontinued. The calculation excludes nonexistent listings and correct recommendations.
That split changes the first diagnostic. For price, compare the answer with the purchasable variant in the cart, under the same currency, membership, quantity and promotion conditions. For availability, check the specific variant and delivery market, then see whether the assistant answered before the stock state changed.
Use the published comparison to decide which categories to log, then use your own repeated checks to choose what to repair. A different catalog mix, source refresh interval or query mix may shift the error pattern. Date each comparison and retain the observation window when you summarize results to the merchandising team.
The overall platform score and the purchasable-offer score can disagree
The First Page Sage comparison gives Gemini a higher weighted shopping score than Amazon Rufus, 88.7 versus 85.7. In the same study, Rufus had the higher share of checked recommendations that were available at the quoted price, 91.3% versus 88.6%. The composite difference is 3.0 score points, while the offer check reverses the lead by 2.7 percentage points. The two results answer different questions, so choosing the highest composite score does not automatically select the strongest offer check.
Rufus searches Amazon’s catalog. The other tool can operate over a different set of sellers, so the difference cannot isolate model ability from catalog and integration differences. A DTC merchant that needs to recommend its own variant should verify the product and offer on its own site before using a ranking from another platform as a procurement decision.
Test product correctness, price and availability on the same recommendation
Ask for the same family of products under a consistent target market, quantity and delivery deadline. Keep an exact product and variant reference for each question. When the answer names an offer, record the source, currency, quoted terms and time checked. Verify the product identity and the purchasable price and stock separately. A recommendation that suggests a good item and shows an expired promotional price can therefore succeed on discovery and fail on the offer.
If a platform can name several merchants, count the answer as a verified offer only when the specific merchant and option satisfy the criteria. When a user asks for a shortlist without a price ceiling, the strongest answer may be a clearly labeled alternative. Keep exploratory questions and price-specific questions in separate scorecards. The composite can help compare a broad experience after the individual hard failures are visible.
Study data
| Measure | Value | Context |
|---|---|---|
| Amazon Rufus, wrong price | 3.9% | Exclusive outcome in the published classification |
| Amazon Rufus, out of stock or discontinued | 4.5% | Exclusive outcome in the published classification |
| Amazon Rufus, product does not exist | 0.3% | Exclusive outcome in the published classification |
| Google Gemini, wrong price | 6.2% | Exclusive outcome in the published classification |
| Google Gemini, out of stock or discontinued | 4.3% | Exclusive outcome in the published classification |
| Google Gemini, product does not exist | 0.9% | Exclusive outcome in the published classification |
| ChatGPT, wrong price | 8.1% | Exclusive outcome in the published classification |
| ChatGPT, out of stock or discontinued | 5.6% | Exclusive outcome in the published classification |
| ChatGPT, product does not exist | 1.4% | Exclusive outcome in the published classification |
| Claude, wrong price | 9.3% | Exclusive outcome in the published classification |
| Claude, out of stock or discontinued | 6.8% | Exclusive outcome in the published classification |
| Claude, product does not exist | 2.2% | Exclusive outcome in the published classification |
| Microsoft Copilot, wrong price | 10.4% | Exclusive outcome in the published classification |
| Microsoft Copilot, out of stock or discontinued | 7.6% | Exclusive outcome in the published classification |
| Microsoft Copilot, product does not exist | 1.8% | Exclusive outcome in the published classification |
| Meta AI, wrong price | 12.6% | Exclusive outcome in the published classification |
| Meta AI, out of stock or discontinued | 8.9% | Exclusive outcome in the published classification |
| Meta AI, product does not exist | 2.1% | Exclusive outcome in the published classification |
| Grok, wrong price | 12.9% | Exclusive outcome in the published classification |
| Grok, out of stock or discontinued | 9.4% | Exclusive outcome in the published classification |
| Grok, product does not exist | 2.9% | Exclusive outcome in the published classification |
| DeepSeek, wrong price | 17.8% | Exclusive outcome in the published classification |
| DeepSeek, out of stock or discontinued | 13.2% | Exclusive outcome in the published classification |
| DeepSeek, product does not exist | 5.5% | Exclusive outcome in the published classification |
What changes when you compare the figures
| Comparison | Result | Calculation |
|---|---|---|
| Amazon Rufus, combined wrong-price and stock share | 8.4% | = 3.9 + 4.5 |
| Amazon Rufus, price or stock as a share of classified errors | 96.55% | = (3.9 + 4.5) / (100 - 91.3) * 100 |
| Google Gemini, combined wrong-price and stock share | 10.5% | = 6.2 + 4.3 |
| Google Gemini, price or stock as a share of classified errors | 92.11% | = (6.2 + 4.3) / (100 - 88.6) * 100 |
| ChatGPT, combined wrong-price and stock share | 13.7% | = 8.1 + 5.6 |
| ChatGPT, price or stock as a share of classified errors | 90.73% | = (8.1 + 5.6) / (100 - 84.9) * 100 |
| Claude, combined wrong-price and stock share | 16.1% | = 9.3 + 6.8 |
| Claude, price or stock as a share of classified errors | 87.98% | = (9.3 + 6.8) / (100 - 81.7) * 100 |
| Microsoft Copilot, combined wrong-price and stock share | 18.0% | = 10.4 + 7.6 |
| Microsoft Copilot, price or stock as a share of classified errors | 90.91% | = (10.4 + 7.6) / (100 - 80.2) * 100 |
| Meta AI, combined wrong-price and stock share | 21.5% | = 12.6 + 8.9 |
| Meta AI, price or stock as a share of classified errors | 91.1% | = (12.6 + 8.9) / (100 - 76.4) * 100 |
| Grok, combined wrong-price and stock share | 22.3% | = 12.9 + 9.4 |
| Grok, price or stock as a share of classified errors | 88.49% | = (12.9 + 9.4) / (100 - 74.8) * 100 |
| DeepSeek, combined wrong-price and stock share | 31.0% | = 17.8 + 13.2 |
| DeepSeek, price or stock as a share of classified errors | 84.93% | = (17.8 + 13.2) / (100 - 63.5) * 100 |
| ChatGPT wrong-price share among the two classified offer issues | 59.12% | = 8.1 / (8.1 + 5.6) * 100 |
| Amazon Rufus wrong-price share among the two classified offer issues | 46.43% | = 3.9 / (3.9 + 4.5) * 100 |
| Difference in wrong-price share within the offer-issue bucket | 12.7 percentage points | = 8.1 / (8.1 + 5.6) * 100 - 3.9 / (3.9 + 4.5) * 100 |
| Gemini composite lead over Rufus | 3 score points | = 88.7 - 85.7 |
| Rufus lead in correct, available at quoted price | 2.7 percentage points | = 91.3 - 88.6 |
| Relative rate of checked offers outside the correct-available bucket, Gemini versus Rufus | 1.31 times | = (100 - 88.6) / (100 - 91.3) |
Methodology and sources
We transcribed the eight platform rows in First Page Sage’s 2026 public accuracy table and confirmed that the four rounded classes sum to 100% in each row. The combined figure adds the two exclusive categories. Conditional error composition divides that sum by 100 minus the correct share for the same platform. We retain the original classifications and do not pool platforms. Google Merchant Center’s price-mismatch instructions provide operational context and no benchmark rate.
Download the source data (CSV)
Download the calculations (CSV)
Download the citation notes (CSV)
Related reading
AI shopping recommendation accuracy statistics
Ecommerce product review statistics and what shoppers use to decide
Sources and definitions
First Page Sage, Which AI Is Best for Shopping?
The source data includes the population, period, denominator and limitations for every figure.